
Kestrel TSCM Software is a highly evolved TSCM | SIGINT | ELINT specific, operator centric SDR application. We make no apologies for the advanced capability of our industry disruptive, standards‐based capability. We meet the new and evolving challenges of technical operators. Whether working within private, corporate, regulatory or law‐enforcement sectors; government, military, special forces, and the national security apparatus. They are faced with a modern moving target threat model, in combating the insidious and growing threat of cyber‐espionage, terrorism, and the devastating financial damage and lost business opportunities caused by state sponsored economic‐espionage.
The Kestrel TSCM Software is not a simplistic desktop spectrum analyzer, offering limited capability. Rather, it is a highly deployable, mission scalable, travel-friendly, full- featured TSCM focused product for professionals. Kestrel TSCM® Professional Software engages and brings the professional technical operator back into the equation. Innovative and many advanced never-before-seen features included standard. Optional features enhance functionality and capability even further. Kestrel TSCM Software is mission adaptable, scalable, upgradable, and well‐positioned to generate the opportunity for new and recurring revenue streams. It exponentially improves real‐world Probability of Intercept (POI) and Probability of Detection (POD) for the end‐user. It embraces a modern moving target threat model, as defined under the TSB 2000 (Technical) Standard™.
The technical operator, not the equipment manufacturers,are now defining and redefining field deployment capability. The modern SDR resources are decidedly founded on an entirely new professional service methodology! It is the experience and real‐world needs of professional technical operators like you that continue to drive the success and the future of the Kestrel TSCM® Professional Software, from a new development prospective. Perhaps your innovative Software Defined Radio (SDR) idea or feature will be added to the next official release of the Kestrel TSCM® Professional Software!
Various options are available which require a needs-analysis. Please call to discuss your requirements. This is a controlled software product from North America which is only sold to authorised end-users.


The operator centric, workflow based, User Interface (UI) enables unprecedented operational effectiveness by grouping and dynamically linking essential control elements and control groups up-front, making them easily accessible and intuitive to the operator.
All essential technical operator control groups are visible on the user-interface or directly accessible from the menu bar or the sidebar control group.
The Kestrel ® UI provides ease of use not found on competitive TSCM products or test and measurement equipment designed for engineering applications in a controlled laboratory environment.
Moreover, the system utilizes predictive logic and intelligent automation to minimize operational deployment complexity, thereby maximizing key performance metrics, such as the Probability of Detection (POD) and Probability of Intercept (POI) metrics.
Our advanced dynamic control linking, sophisticated artificial intelligence and predictive logic, provide recommended system settings that offer excellent performance in even the most demanding spectrum environments, while giving experienced operators the ability to optimize system settings for their target application manually.
The RF Spectrum Display (RSD) is an important tool for visualizing and interpreting signals. Basic forms of the traditional power versus frequency spectral display are useful for many engineering applications, but a more sophisticated display is needed to make sense of the complex RF spectrum found in many real-world scenarios.
Frequency hopping and other short duration transmissions often used by modern communications technologies pose special problems. The spectrum display benefits from extensive practical experience, and provides an array of useful features and functionalities specific to the TSCM role.
The user can select options for spectral processing parameters, such as the choice of windowing function at the hardware and software level.
A wide variety of visual trace options are available to the technical operator, including a Real-Time Event (RTE) trace, a Peak Envelope Capture (PEC) trace and a Spectral Average (SAT) trace, are all available to enhance the Probability of Technical (POD) and minimize unwanted RF display clutter. The user can display or hide the RF Spectrum Display (RSD) as desired without interrupting, or otherwise affecting the data processing and collection.
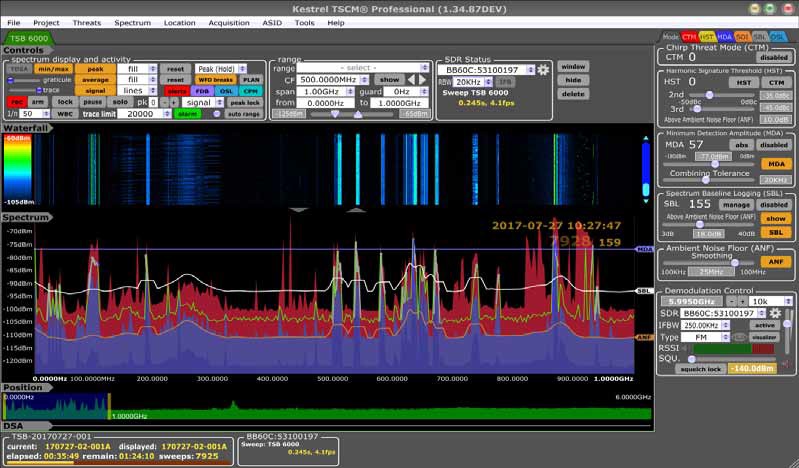
The waterfall display (WFD) is particularly useful for detecting and examining short duration signals including Frequency Hopping Spread Spectrum (FHSS) and other burst signals. Using the real-time spectrum analysis mode, even the shortest duration signals can be reliably detected and their timing relationships examined.
The waterfall and spectra are recorded in real-time and provides the ability to immediately review signal events using our Live View Analysis (LVA) TM feature without interrupting the processing and collection functionality. All RF spectrum and waterfall data is captured and stored on the host computer, enabling the user to employ Live View Analysis (LVA) TM functionality for subsequent analysis.
The user has full and unrestricted control of the data collection process and can define multiple activity schedules to include deployment of the Delay Start Mode (DSM) TM, or the ability to collect spectral data for a specified period of time, allowing for multiple start and stop events to occur at the band or receiver level.
The default continuous mode, permits the technical operator to continuously collect waterfall spectral data until the software is manually stopped by the operator. This capability allows the technical operator to playback specific spectral time events during runtime collection and for post-analysis.
Independent waterfall reference level scaling, another powerful tool, permits the technical operator to display the RSD and WFD at different reference level power settings, thereby enabling the color representation of the WFD to be optimized for signals of interest under review.
The user can display or hide the Waterfall Display (WFD) as desired without interrupting, or otherwise affecting the data processing and collection.
The ability to zoom to the strongest signal event over time within the Waterfall Display (WFD) provides essential analytical information for the operator, particularly when time-periodic signal events intermittently occur during extended collection.
One of the powerful standard features of the the Kestrel TSCM ® Professional Software is the ability to import any type of floor plan, riser plot, geo-graphical map, 3D rendering, image or picture.
The floor plan import graphically interfaces with every location-based feature.
The same resource provides a unique Location Differential Signal Analysis (LDSA) TM overlay and advanced geo-location heat mapping for the Tap Capture Plot (TCP) TM and Dynamic Trace Autonomous Platform (DTAP-GPS) TM.
The ability of the user to define separate bands or frequency ranges of interest and assign a dedicated window to display the spectral information for each of these is another unique feature that is not found on competitive TSCM applications. Each user-defined frequency range can be viewed on a primary display monitor as a standard windows TAB, or viewed on a dedicated display monitor in a multi-monitor setup.
This ability to sweep and display multiple independent spectrum windows provides the user with multiple virtual spectrum analyzers, enabling the user to prioritize selected frequency ranges and maximizing the available spectral search speed.
For example, the operator can open and sweep any number of cellular uplink bands when performing live meeting monitoring assignments.
The TAB based Intelligent interface windowing control group enables the technical operator to easily setup, navigate, view and analyze, multiple instances of independent spectral data in a familiar windows style TAB based format. The ability to monitor the same band remotely on another display is also fully supported.
A wide range of global and independent viewing preferences can be set for each currently active spectrum window. The ability to quickly select and view any portion of a displayed ROI and open a new focused zoom window is fully supported utilizing the “Open New Band” selection tool, and enabling “SOLO” mode. The “SOLO” Mode adds an entirely new “sweep” gear, giving real-time priority to the new focused zoom window during runtime.
The Kestrel TSCM Professional Software contains a powerful operator defined spectrum profile database resource to assist in the initial setup and runtime of a Kestrel Project File (KPF) TM. This powerful managed database brings clarity and reason to a complex mission driven process.
The ability to select, edit, delete, import and export mission critical spectrum profile information across any ITU-R is supported by a built in Spectrum Profile Editor (SPF) TM or via a standard CSV master file structure.
HRC TM provides a unique precision navigation capability based on default and operator defined Spectrum Profiles (SPF) TM to quickly zoom into to defined bands, sub-bands and custom spectrum ranges.
The ability select custom analytical profiles ranges for advanced power line algorithmic geo-location and operator assisted, live view spectrum analytics.
Navigating the RF spectrum has never been this easy! The easily accessed PZCTM window allows the operator to navigate to and zoom in on a signal of interest. A right-click allows the operator select from a list of predictive logic zoom control options, based on the current CF displayed on the spectrum interface.
Kestrel ® Drag and Drop Technology (DDT) TM focuses the SOI at its center frequency with an automatic 20x zoom factor. A 100x double click zoom is also available to further focus attention on the SOI. A 200x zoom factor is accomplished utilizing the mouse wheel.
The on-the-fly drag and drop capability supports demodulation processing by selecting the SOI center frequency and selecting the demodulation menu option. The Kestrel ® spectrum control group supports the ability to set the CF, SPAN, START and STOP frequencies manually.
The DSATM feature to display any multiple-location based peak-trace and highlight differences is enhanced by the PZCTM functionality. One can easily switch between viewing entire ROI or a specific SOI with a 200x zoom factor. This functionality enables even minor noise-floor amplitude differences to be readily discerned.
Our navigation control options are highly evolved and consider every possible scenario providing many navigation options at the application level.
The LVA TM feature provides a means of real-time operator analysis and review of continuous and intermittent signal events. LVA TM makes it possible to navigate to any historical spectra or waterfall event without the need to interrupt the data collection process, which continues to run in the background.
Additional tools allow the operator to locate the strongest occurrence of the SOI and our seamless Positional Zoom Control (PZC) TM and trace display options bring clarity and focus to the characterization of any historically recorded signal event during collection or post analytical review.
Under the DSA TM umbrella, three (3) very powerful resources provide unprecedented opportunity for the timely detection, identification, and localization of modern threat technology, simply not possible with competitive resources.
The software provides several powerful modes based on Location, Time, and Radio differential analytics.
The Location Differential Signal Analysis (LDSA) TM allow the operator to manually collect spectrum data for direct location comparative with technology dating back to the 1970’s within the military and found within many HP spectrum analyzers in the 1980’s. Although, location comparative is nearing obsolescence in a modern moving target threat model, the technique remains a viable option when utilized with time and radio differential techniques.
The LDSA TM, TDSA TM, and TCP TM allow the operator to build unlimited comparative analytical collection points. The Advanced Location Groups (ALG) TM feature allow the selection of defined location groups for direct comparative analysis.
The ability to import any shape spectra from any number of historical project files allows the operator to compare alternate sources of trace level peak data by importing shared or historical Kestrel Project Files (KPF) TM.
The Time Differential Signal Analysis (TDSA) TM offers a modern approach to the identifying modern threat technology without the inefficiencies of location trace analysis.
RDSATM provides enhanced comparative opportunities with the ability to overlay spectrum from all connected radios, for a real-time view of the signal across multiple radios at multiple locations.
This unique mode allows the operator to select any number or source of historical trace data sets for direct comparative against a live real-time reference trace.
The sidebar demodulation control group provide all of the required one touch controls to quickly select signal events and engage the demodulator.
This function can be accomplished manually or via our unique drag and drop technology from all spectrum signal lists and tools.
Significant advancements have been implemented resulting in a powerful signal demodulation process within the application. Flexible software demodulators are included for AM, FM, SSB (USB | LSB), and CW signals. Demodulation settings, including the Centre Frequency (CF), IF Bandwidth (IFB), and CF stepping make the demodulation process a simple task.
The demodulation visualizer provides the operator with analytical quality visualizations and a selection of IF specific audio filter options, to optimize the demodulation performance for the signal of interest.
Demodulated signals (audio and IQ) can be recorded and played back, and examined using various real-time displays. Visualization resources provided within the demodulation control group include a real-time RF Display (RFD), Audio Spectrum Display (ASD), IQ Diagram (IQD), IQ vs Time Display (IQT), RSSI History Display (RHD), and an Analog RSSI Display (ARD).
The demodulation visualizer includes an RSSI Tone Locator (RTL) with multiple audio channel overlay to allow the live device audio, tone locator audio or both as output options.
The included Audio Oscilloscope Display (OSD) functionality provides a visual time domain rendition of the demodulated signals and provides gain control, Delta-T variation, time base, and triggering resources. The ability to decode CW mode unencrypted Morse Code transmissions and display the intelligence directly on the UI is supported. The AF Spectrum Display (ASD), fully supports the ability to analyze signal events, including the visualization of Sub-Carrier Audio (SCA) signals, and other unique signal features at the baseband level.
Perhaps the most important component of the demodulation visualizer is the ability to manually capture IQ, playback IQ, loop IQ, and accomplish Time Reference Sub-Sampling (TRSS) TM.
IQ processing is identified as an essential best practice within the TSB 2000 (Technical) StandardTM.
Audio and IQ samples can be used to develop a user signal recognition database, for training purposes, and definitive evidence of threat signal activity.
The ability to capture Kestrel IQ (KIQ) TM, CSV IQ, WAV IQ provide powerful mission specific options for the technical operator.
Additional IQ playback modes include XML IQ, DGZM and DGZ formats.
The technical operator can capture an audio sample of any signal of interest during the demodulation process with the Kestrel TSCM Software. The captured WAV file can be played back within the software.
Active threat detection modes include, our Minimum Detection Amplitude (MDA)TM exceedance capture, Spectrum Baseline Logging (SBL)TM signal logging, a powerful Dynamic Alert Annunciator (DAA)TM, Harmonic Signature Threshold (HST)TM algorithm, and analog audio transmitter, Chirp Threat Mode (CTM)TM. Utilizing the Harmonic Signature Threshold (HST)TM feature allows the technical operator to capture and flag harmonic relationships based on the detected fundamental signal event.
The detection of analog audio transmitter threat technology is supported utilizing an active audio Chirp Threat Mode (CTM)TM to chirp the target area and positively identify the presence of active, potentially hostile emitters. Our custom active audio chirp is designed to address audio frequency ranges associated with active device microphones that may be associated with analog audio transmitters.
Note: Our Technical Research and Standards (TRSG)TM has conducted significant scientific research and development experiments of the use of white and pink noise suitability for active device detection.
Our finding suggest that the use of white-pink noise is not advisable or recommended for TSCM deployment across most corporate, government, and military facilities as a means of transmitter detection as there are far too many competing white and pink noise sources.
Competing sources include HVAC system output, client installed noise cancelling technology and other sources that directly interfere with white-pink noise detection strategies.
Limitations based on the location and distance of the emitter from the detection system is a significant concern. The white and pink noise range ironically, is within the design noise-cancelling region of most wireless microphone elements and commercial broadcast transmitter technology.
During the detection of analog audio transmitters, algorithmic analytics is performed to detect, identify and flag associated harmonic events.
The ability to set an extended Above Ambient Noise Floor (AANF)TM baseline exceedance threshold provides the unique ability to better detect signal events across an extended Range of Interest (ROI).
The MDATM threshold level is operator defined and can be setup for ABS or REL (default) modes.
Signals the exceed the active threshold are appended to the MDA signal list and can be exported as a CSV file.
The unique SCTTM feature detects and flags wide band signal events based on default or operator defined parameters. When the operator defined MDATM limit is exceeded, often only a portion of the signal will be capture. This producing fragmented signal capture and numerous signal list entries. SCT TM resolves these signals by detecting and automatically combining them into a single center-frequency and bandwidth. Erroneous captures are flagged as ignored and identified as such on the MDA TM signal list.
Note: Although we do employ a measure of artificial intelligence and machine learning across the application, this is perhaps best described as “intuitive automation” that provides and integration of our 40+ years of operational deployment experience.
This extensive knowledge is imprinted in every line of source code and is part of the artificial intelligence interoperability that so many technical operators have positively commented on over the years.
The intelligent Signal Combining Technology (SCT)TM is just one example, and is the first step in accurately characterizing wideband Signals of Interest (SOI). The SCTTM feature supports the accurate capture, measurement and display of wide bandwidth signals, eliminating nuisance noise floor fluctuations at the signal level by identifying and logging the events for operator review.
The powerful geo-location heat mapping resources are yet another example of the application of low-level artificial intelligence within the Tap Capture Plot (TCP)TM and Dynamic Trace Autonomous Platform (DTAP-GPS)TM options.
This feature is designed to capture a clean signal list, without any active threat detection. The operator can quickly capture a detailed SBLTM list of all location specific target area signal events based on an operator defined Above Ambient Noise Floor (AANF)TM threshold.
The operator is able to save and clear the rendered signal list for each Location Differential Signal Analysis (LDSA)TM collection location.
Exported SBLTM signal list data is saved as a standard CSV file and can be rendered within the Session Report Generator (SRG)TM and the Advanced Report Generator (ARG)TM.
The SRGTM is fully integrated and allows for real-time, on-the-fly ad-hoc report generation in the standard Portable Document File (PDF) format. The SRGTM allows the operator to capture plots of the RF Spectral Display (RSD) and Waterfall Display (WFD) data, for inclusion within the report. This resource provides the means to export a comprehensive RF based report that can be utilized as an attachment to a end-user report.
The Kestrel ® Project File (KPF), is an integral component of the overall project file management structure. It is also possible to export any of the threat or signal lists as a (.CSV) file format for editing, or analysis in third party productivity software.
The SRGTM functionality provides a level of sophistication never before seen within a TSCM | SIGINT specific software application.
The ARG TM is a powerful standards-based Report Management System (RMS)TM that is expertly integrated into every aspect of the Kestrel TSCM Software allowing the technical operator to build custom proprietary reporting solutions with extreme versatility. The ARGTM resource is second to none in the industry and provides total control over the reporting process across the entire assignment as a template-based master report builder.
Our document tree structure, intuitive drag and drop technology, automatically generator formatting tools, allow the technical operator to custom define sectional information and include cover page, logo, data tables, images, pictures, spectra plots, text, sections, headings and sub-headings, automatic page numbering, across any conceivable report design and format required.
The importance of a standards-based report manager resource cannot be under-estimated in todays liability and litigation focused society. Comprehensive reports are yet another essential best practice as defined within the TSB 2000 (Technical) StandardTM.
Operators that deploy the software for remote monitoring applications benefit from the periodic export of all, or newly detected signal events based on operator defined time or trigger parameters. The ability to define the automatically exported CSV signal list elements further refines the process and provides actionable RF intelligence. The AECTM option also provides a powerful (triggered) IQ capability and separately allows the export of CSV Spectra and RSSI values.
CLPTM is a powerful operator centric resource for extended or remote managed deployment. The ability to define customized Email and SMS network alerts, trigger system actions such as Smart ECM and interface virtually all software programs, third-party demodulation, decoding and analytical applications is supported. Operators can setup unique audio alerts across the application and event produce automatic screen shots based on triggered events.
The AMCSTM option is a very powerful API enabled backdoor into the Kestrel TSCM Software. AMCS TM capability provides advanced users with the ability to build a powerful TCP/IP multiple site remote monitoring platform. This capability is based on the end-users remote client. The AMCS TM option includes a powerful SDK with all the documentation, code examples and both console and a graphical remote client example. The entire platform is based on a simple scripting technology that can be programmed to stream all measurement parameters via a TCP/IP network connection, or optionally, write to the remote host computer.
Finally, dimensional RF propagation modeling has been introduced as a TSCM specific resource! Our TCPTM option includes the ability to import any type of image including floor plans, riser plots, maps, site plans, 3D rendering, images and photographs of the Operator Defined Target Area (ODTA)TM and the extended Functional Target Area (FTA)TM. Support for unlimited imported maps for multiple level buildings or unique locations is supported. The ability to render a geo-location heat mapping process provides evidence of all distributed energy sources as a function of localization. Auto location sequencing provides all of the necessary capture and rendering process, subject to the capture locations selected by the operator. TCPTM allows the operator essentially see RF via a powerful RF Visualizer (RFV)TM technology. TCPTM is a must have feature for every technical operator.
A powerful new technology only available in the Kestrel TSCM ® Professional Software, now makes it possible to utilize algorithmic geo-location heat mapping across the entire electrical power grid within the Operator Defined Target Area (ODTA) TM and any extended Functional Target Area (FTA) TM electrically significant appearance points. Our optional 3D Energy Probe (3DEP-10) provides full integration with our power line analytical spectrum profiles at the application level.
DTAP-GPSTM is a specialized RF propagation modeling resource extension of our existing manually deployed Tap Capture Plot (TCP)TM capability. This option provides a fully autonomous GPS based geo-location heat mapping process for ground mobile, air and space applications.
This powerful option can dynamically update interactively with a network based real-time moving map, or can operate across a static reference map image. DTAP-GPSTM is utilized to capture and plot a wide search Range of Interest (ROI) bandwidth LDSATM capture of the ambient RF spectrum environment.
The ability to include multiple bands of interest, such as control and talk channels, up-link and down-link spectrum blocks is fully supported. The ability to autonomously render a powerful geo-location heat mapping process across any captured bandwidth down to the channel level in both real-time and during post analytical analysis is now a reality.
Our operator centric control group simplifies the advanced field deployment setup parameters of the DTAP-GPSTM option. Once the DTAP-GPSTM is programmed by the technical operator our OneTouchTM technology engages a fully autonomous collection process allowing the technical operator to give 100% focus on walking (backpack), driving (mobile) or flying (airborne), totally hands-free and hands-off. Our OneTouchTM technology allows the DTAP-GPSTM process to be paused and restarted during the mission.
The ability to utilize the optional DTAP-GPS TM feature makes Kestrel ® a true high-flier for professional applications.
Our Remote Piloted Aircraft System (RPAS) + Dynamic Trace Autonomous Platform (DTAP) + Global Positioning System (GPS) is a powerful wide area radio-frequency geo-location heat mapping resource for commercial, government, law-enforcement, military, search and rescue, protective operations, and tactical deployment.
The ability to deploy a tactical intercept solution across a large Operator Defined Target Areas (ODTA)TM with absolute precision, and geo-locate known and unknown Signals of Interest (SOI) quickly and efficiency is an unprecedented TSCM and SIGINT capability.
HELIX-SDK is a powerful state of the art third-party encryption service solution. The Kestrel TSCM ® Professional Software OPT HELIX provides the necessary source code architecture support necessary for the installation of the Helix SDK encryption. OPT HELIX does not include the required third-party encryption service or support.
There are two (2) powerful signal list visualization resources available to the operator during runtime and post analysis review with all signal list data exportable to standard CSV format. Signal list data is also available for inclusion within our Session Report Generator (SRG)TM and our Advanced Report Generator (ARG)TM.
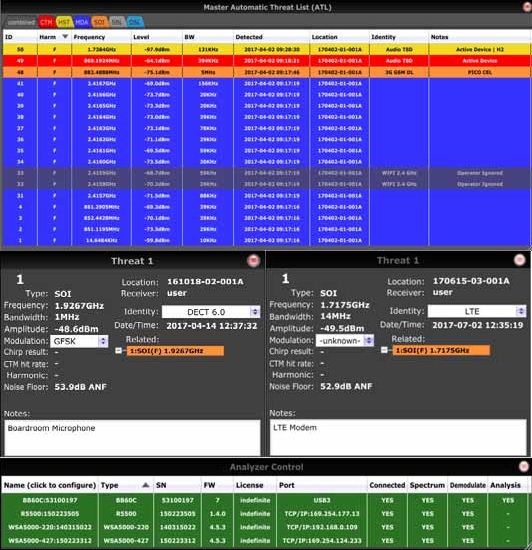
A sidebar ATL TM provides immediate report of all discrete signals identified and captured automatically and manually by the technical operator, including the frequency and signal level, with optionally viewable harmonic ID, dBc and dB ANF values.
A separate Master ATLTM window provides comprehensive signal information including any harmonic relationships, frequency (MHz), signal level (dBm), estimated bandwidth, dBc, dB ANF, dBm NF, dBm Avg, dBm Min, Chirp, Chirp Hits, Chirp Tests, detected date and time and location details.
The operator can also include a signal (identify) category, and enter field notes, relating to each observed signal. Signal events are placed on a uniquely color-coded tabbed table, and available on both the sidebar ATL and on the Master ATLTM for enhanced operator clarity.
The technical operator is able to export from the Kestrel TSCM Softwareindividual signal lists, or all available signal list contents to a single CSV file.
There is a unique resource located in the Spectrum | Spectrum Set | menu structure to define and export CSV Spectra based on start and stop file index parameters and the start and stop frequency range. This feature allows the spectra to be analyzed and graphed utilizing third-part productivity software.
The ability to deploy the software utilizing a single radio allows for simplicity in deployment with considerable flexibility and system scalability as requirements change.
Our advanced Tap Capture Plot (TCP) TM feature allows the operator to deploy a single radio geo-location heat mapping capability for ultimate portability using USB 3.0 connectivity on a tablet computer for walk-about convenience.
The ability to actively deploy a primary and secondary search, or hand-off receiver, provides the technical operator with a wide range of advanced deployment, TSCM | SIGINT specific functionally. When dual receivers are available, the ability to demodulate a Signal of Interest (SOI) is possible without interrupting the collection process as would occur with a Single Receiver Operation (SRO)TM.
DRO TM is identified and defined as an essential best practice under the TSB 2000 (Technical) StandardTM.
The (optional) ability to augment a primary receiver with multiple additional secondary search or hand-off receivers is supported. This is ideal for managed, Remote Spectrum Surveillance and Monitoring (RSSM)TM assignments. Hand-off receivers can be of different types to better cover application requirements and / or accommodate cost constraints.
An example configuration of three receivers, might include an SM200B and a BB60C for real-time demodulation and analysis. The SM200B can collect without interruption and the BB60C can analyse signals of interest. Meanwhile another BB60C can simultaneously monitor the target area Power Line.
The Kestrel TSCM Professional Software supports a wide range of SDR and a number of spectrum analyzer-based front ends. Signal Hound SA, BB and SM series receivers with frequency coverage up to 20 GHz are supported.
Kestrel Support Profiles (KSP)TM are available for select SDR hardware.
The Signal Hound SM200 family of receivers are an excellent choice for TSCM and SIGINT applications. They provide ultra-fast spectral search speed and the ability to accurately capture of IQ signal data for wideband signals.
Custom development of software support for additional search receivers and spectrum analyzers is available. Please contact of office for information.
The introduction of industry leading dynamic radio hand-off of the live spectrum, demodulation, and analysis functions, across any number and type of supported SDR hardware technology is an extremely versatile TSCM | SIGINT capability.
The precision dynamic hand-off algorithmic process, cleanly provides on-the-fly synchronization across all connected radios. The ability to assign or restrict spectrum, demodulation and analysis functions for each radio is supported.
Built-in operator controlled support for third-party USB 2.0 connected RF (Antenna) Switch hardware is supported. Two, four and six Port options are available. Switches can be locally controlled from the host computer or via Remote Desktop Software (RDS), or across a Fiber-Optic Remote.
The Kestrel TSCM Software provides advanced support for USB GPS receiver hardware. This permits the automatic capture of the latitude and longitude coordinates. Manual entry can also be used for the various standards features and optional software modules.
Geographical GPS coordinates can also be entered manually when a GPS signal is not available.
GPS coordinates are also utilized for plotting FCC, IC and AU frequency database reference mapping. This is required for the Dynamic Trace Autonomous Platform (DTAP-GPS)TM capability.
Any connected GPS source can be utilized by the software and can be selected manually by the operator. All active GPS sources are displayed and can be selectedvia the location sources dialog window.
The Kestrel TSCM Software includes a sophisticated multiple level database. This provides the ability to search supported global licensing databases of radio frequency transmitters. Currently USA, Canada and Australia are included. Search and query features provide geographical reference searches and Free Space Power (FSP) searches.
Official licensing database content is available off-line and can reside on the host computer for local search and rendering. There is a automatically scalable spectrum display overlay with accompanying record level details. The ability to select location parameters against FSPL calculations generates bearing and distance to and from the station. This is based on data from multiple locations and triangulation for signals of interest. The FDBTM record data provides a coordinate-based means of plotting the resulting licensing data on a live network map. A detailed scaled reference plot showing the TX and RX stations can therefore be captured.
The OSLTM is fully integrated with the ASIDTM and offers unprecedented functionality. It permits instant comparative analysis across multiple project files at the operator level.
The OSL TM feature allows the operator to generate any number of reference database files. Multiple mission critical reference files are maintained throughout. The OSL™ can recall and display signal entries against the current real-time RSD as a graphical overlay.
The Kestrel TSCM Software includes a fully integrated DAA™. This includes unlimited automatic signal event detection across multiple search receivers, analyzers, band allocations, or any technical operator defined ROI.
RED | GREEN visual indicator and audio alert capability provides a true GO | NO GO verification of signal level. This is idea for live facility monitoring and SCIF environments.
The ability to detect signal loss and exceedance threshold limits and generate alerts can be programmed independently. Each alert zone is an independent detection resource supporting operator defined absolute and relative modes across the spectrum.
The ability to invoke a DAA TM status display directly on the UI is supported. This resource provides direct operator access to the primary DAA TM control window and signal list.
The harmonic/sub-harmonic calculator provides the ability to drag/drop any frequency to or from the calculator to focus any frequency. For clarity this is performed at a 20x zoom factor. The harmonic calculator provides harmonic calculation of H2 to H9 and 1/H2 to 1/H9 based on an operator defined center-frequency.
A universal translator based on value substitution to render the missing elements is provided. This converts between common RF reference values such as dBW, dBm , mV/FS, mV/75R, mV/50R, Watts, mW, and uW.
The SRM TM is a host computer performance evaluation tool, active memory monitor and storage drive health resource.
The DMT TM provides the ability to quickly determine the differential for frequency, dBm and time. The DMT TM resource is available for the RTE, WFD, DSA control groups. It is implemented within the Demodulation Visualizer for the Audio Oscilloscope display.
The software includes a powerful activity/event scheduler. It can independently start/stop any spectrum band across any radio to control any number of spectrum bands.
The auto restart command provides a means to automatically restart the Kestrel TSCM Software and last running project file. A crash, computer update, or operator reboot command will initiate the auto restart protocol.
The ability to create, edit, select and delete any number of operator defined working project templates is fully supported. The ability to same the current project as a template is also supported.
The ability to assign any number of unique spectrum display profiles is supported. This allows complex display options from a simple menu rather than manually creating display views each time they are required.